VTV-AMR:
Visualization of Time-Varying Adaptive Mesh Refinement Data
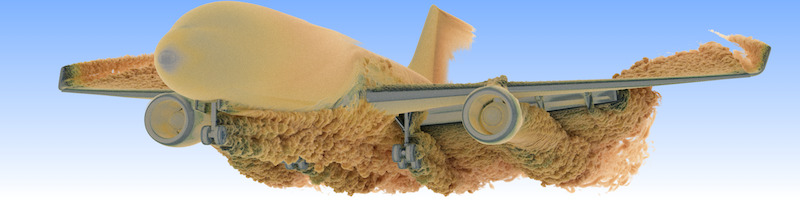
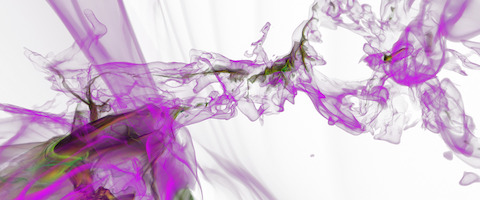
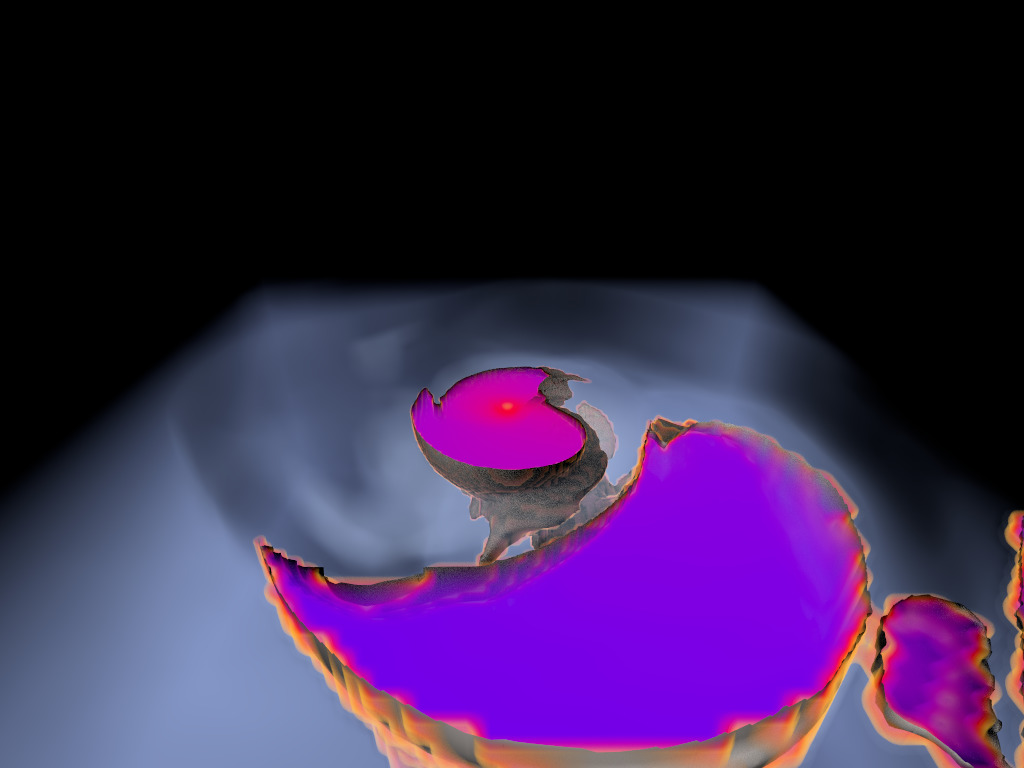
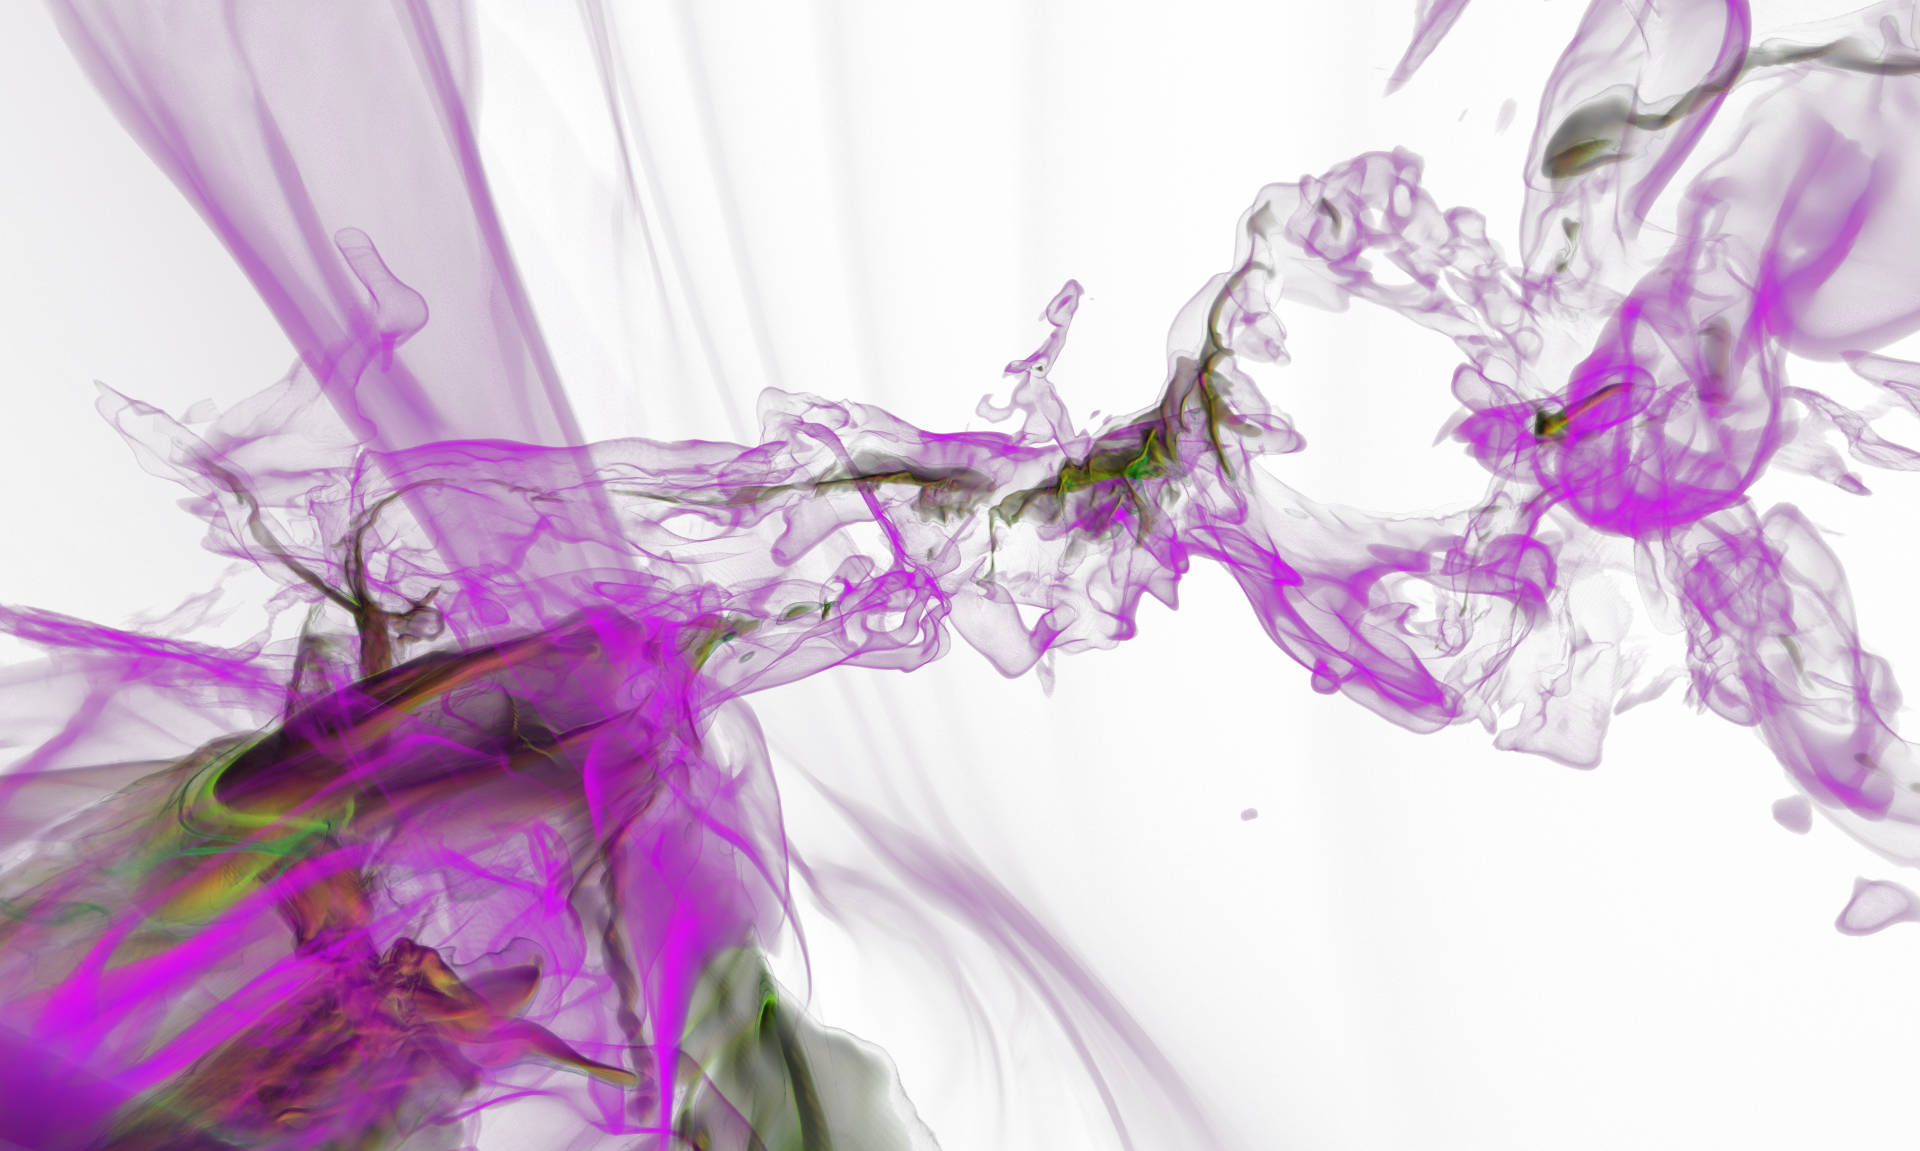
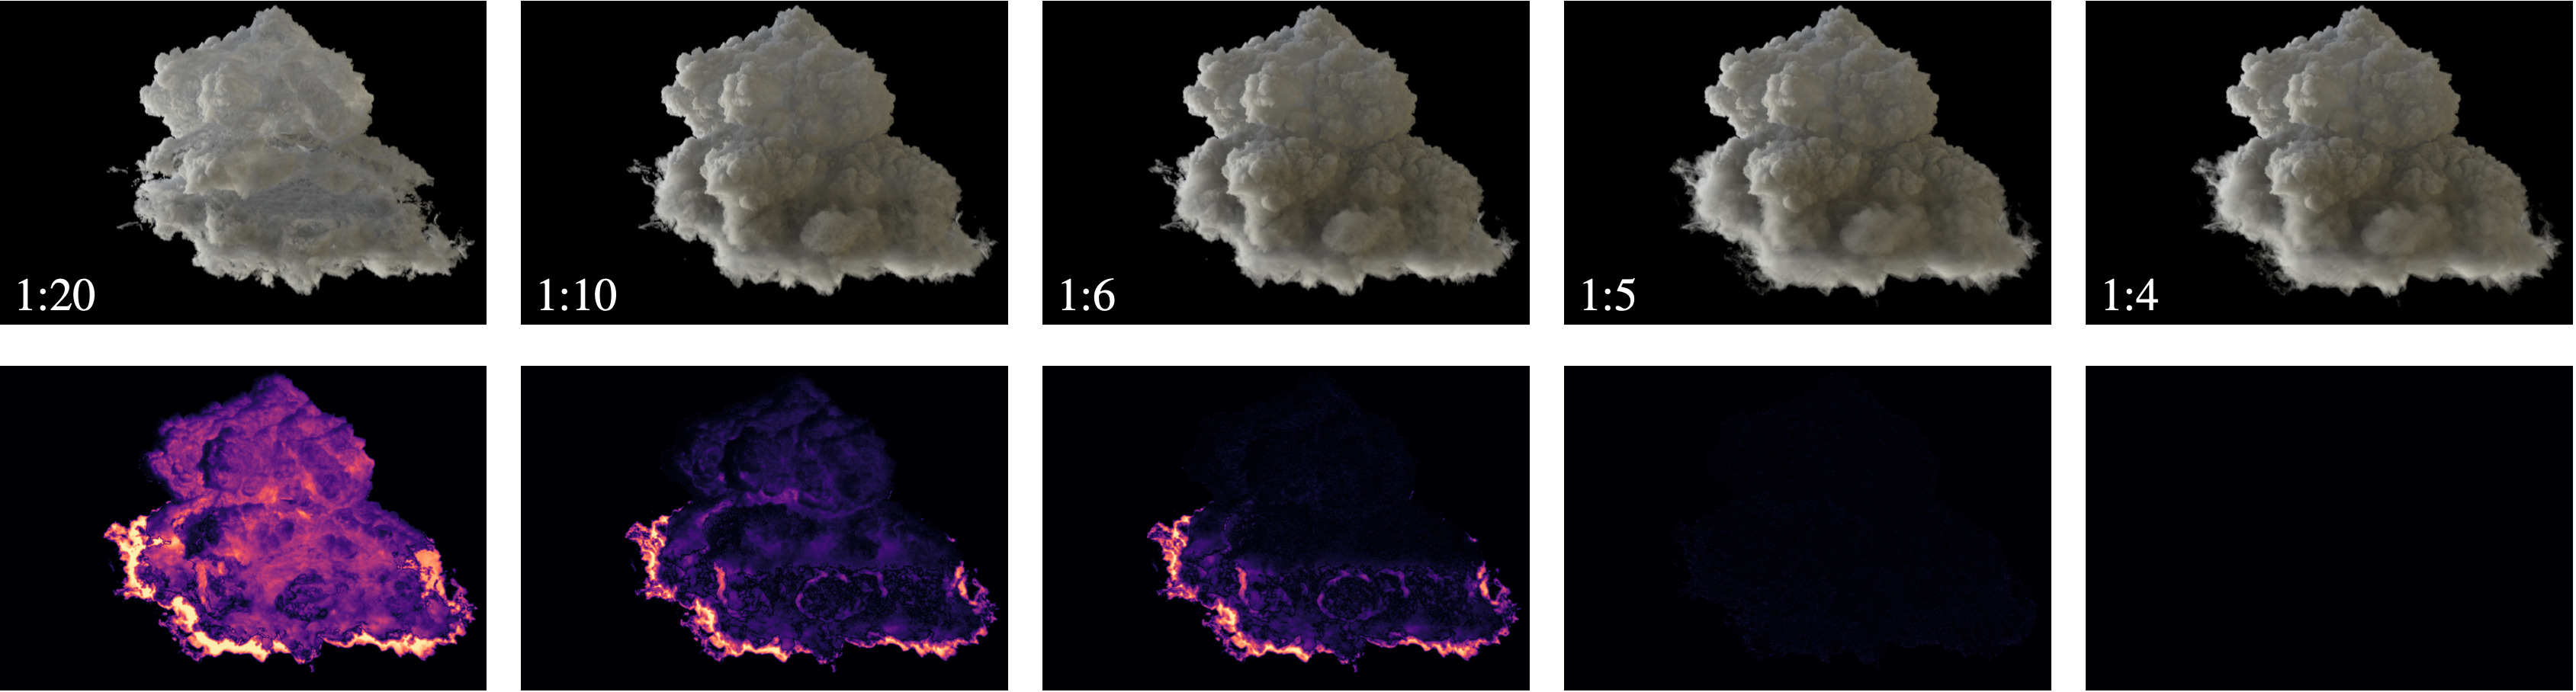
Figure 1. AMR data sets visualized with tools developed
during the course of this project. Left: NASA's exajet data set, a
large tree-based AMR data set, path traced using multiple scattering
on an RTX GPU. Right: molecular cloud data set rendered with emission
and absorption. Both data sets have complex AMR hierarchies and are
time-dependent, making this particularly challenging to render on
GPUs.
Project Scope
Adaptive mesh refinement (AMR) is used by 3D computational fluid dynamic (CFD)
solvers to focus the computation on interesting regions in space (and time). Popular AMR codes
that were, e.g., used to produce the two data sets in Fig. 1 are
NASA's
LAVA
fluid solver or
FLASH by the University of Rochester.
Examples of AMR
topologies are
Octrees,
but other tree types, branching factors, shapes, etc. are possible.
AMR codes virtually always store the data (density, temperature, velocities, etc.) at the "cell centers".
For that, imagine the cell to be a small box. "Vertex-centric" methods associate the data with
the box corners, while "cell-centric" means the data is stored at the center of the box.
Efficient and high-quality visualizations usually have to reconstruct the data at arbitrary sample points
and for that need to be able to quickly identify
rectangular neighborhoods.
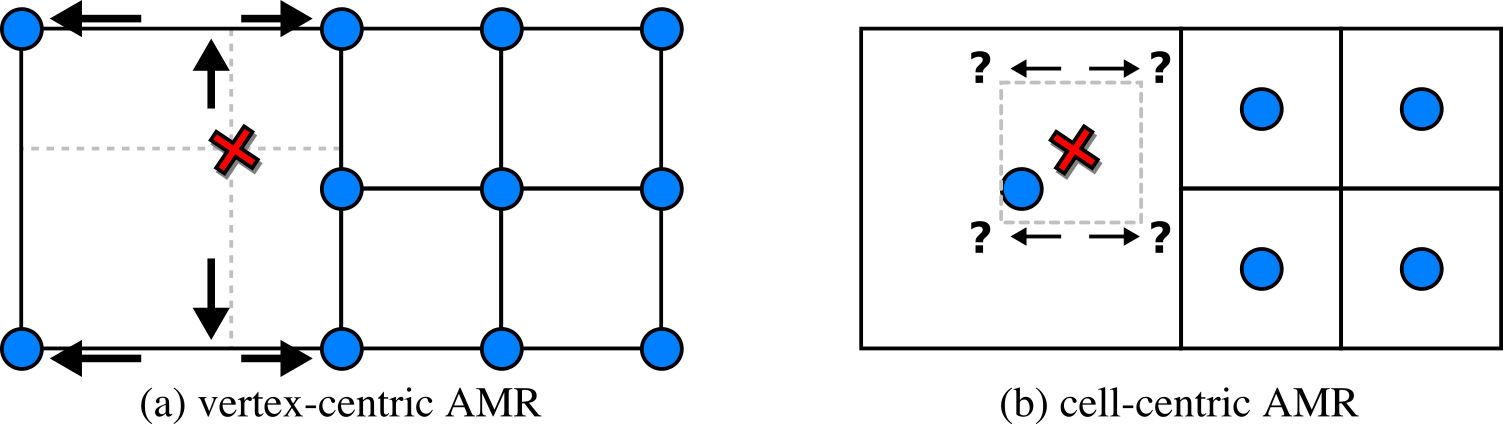
Figure 2. The main challenge with the data we focus on is
interpolation at level boundaries. While this is trivial when the
data is vertex-centric (a), challenges arise with cell-centric data
(b). Virtually all AMR codes of interest generate cell-centric
data.
In Fig. 2 (a), with vertex-centric data, this is simple, as when we move up/down, left/right,
from front to back, we eventually find the
nearest data points for the sample position
to form a rectangular region. In Fig. 2 (b), with cell-centric data, finding that neighborhood
is non-obvious even in the simplest of cases, and has led to visualization packages such
as
OSPRay to incorporate complicated
auxiliary data structures to perform
cell location. Other visualization packages
support this kind of data, but don't effectively handle the "level boundaries" where cells
of different sizes connect, and produce cracks and other artifacts when
isosurfaces
or
volume renderings
are generated from this kind of data.
In VTV-AMR,
our focus is on crack-free visualizations with
state-of-the-art GPU ray tracing technology to produce high-quality renderings,
and hence we have to use the aforementioned auxiliary data structures;
unfortunately, the memory footprint and construction times of such data
structures are not targeted at real-time performance, nor at time-varying data
comprised of multiple simulation time steps with adaptively changing AMR grids.
Our contributions will advance the state-of-the-art in high-quality AMR
data reconstruction of cell-centric data on GPUs to interactively visualize
data sets composed of 100s to 1000s of time steps. We focus on data where even
single time steps saturate most of the available GPU memory. For that, we build
on state-of-the-art
software solutions
that were recently published in
leading international research journals, and that we will extend to
support time-varying data.
The "
NASA exajet" data set is courtesy Pat Moran.
The molecular cloud data set is reused with friendly permission by Daniel Seifried with the
Theoretical Astrophysics Group of the University of Cologne. For more visualizations, check out
the
Visualizations subpage.
Publications
Journal Papers
-
A. Sahistan, S. Zellmann, H. Miao, N. Morrical, I. Wald, V. Pascucci (2026),
"Materializing Inter-Channel Relationships with Multi-Density Woodcock Tracking".
Accepted: Transactions on Visualization and Computer Graphics, 2026.
Author version
-
A. Sahistan, S. Demirci, I. Wald, S. Zellmann, J. Barbosa, N. Morrical, U. Güdükbay (2025),
"Visualization of Large Non-Trivially Partitioned Unstructured Data with Native Distribution on High-Performance Computing Systems".
Transactions on Visualization and Computer Graphics, Vol. 31 (9), 2025.
Link
-
S. Zellmann, Q. Wu, A. Sahistan, K.-L. Ma, I. Wald (2024),
"Beyond ExaBricks: GPU Volume Path Tracing of AMR Data".
Computer Graphics Forum, Vol. 43 (3), 2024.
Link
-
N. Morrical, S. Zellmann, A. Sahistan, P. Shriwise, V. Pascucci (2023),
"Attribute-Aware RBFs: Interactive Visualization of Time Series Particle Volumes Using RT Core Range Queries".
IEEE Transactions on Visualization and Computer Graphics, Vol. 30 (1), 2024. (IEEE Visualization 2023).
Link Author version Supplemental material
-
I. Wald, M. Jaros, S. Zellmann (2023),
"Data Parallel Multi-GPU Path Tracing using Ray Queue Cycling".
Computer Graphics Forum, Vol. 42 (8), 2023.
-
J. Sarton, S. Zellmann, S. Demirci, U. Güdükbay, W. Alexandre-Barff, L. Lucas, J.M. Dischler, S. Wesner, I. Wald (2023),
"State-of-the-art in Large-Scale Volume Visualization Beyond Structured Data".
Computer Graphics Forum, Vol. 42 (3), 2023.
-
S. Zellmann, Q. Wu, K.-L. Ma, I. Wald (2023),
"Memory-Efficient GPU Volume Path Tracing of AMR Data Using the Dual Mesh".
Computer Graphics Forum, Vol. 42 (3), 2023.
Author version Author version (high res)
-
S. Zellmann, D. Seifried,
N. Morrical, I. Wald, W. Usher, J.P. Law-Smith, S. Walch-Gassner, A. Hinkenjann (2022),
"Point Containment Queries on Ray Tracing Cores for AMR Flow Visualization".
Computing in Science and Engineering (CiSE), Special Issue: Hardware-Accelerated Ray Tracing for
Scientific Applications (Mar/Apr 2022)
Link
-
I. Wald, S. Zellmann, W.
Usher, N. Morrical, U. Lang, V. Pascucci (2021),
"Ray Tracing Structured AMR Data Using ExaBricks".
IEEE Transactions on Visualization and Computer Graphics, Vol. 27 (2), 2021.
Author version Link
Conference Papers (all peer-reviewed)
-
S. Zellmann, I. Wald (2025),
"From Soup to Bricks: Fast Clustering of Fine-Grained AMR Hierarchies for Rendering on GPUs".
The 15th IEEE Symposium on Large Data Analysis and Visualization (LDAV 2025)
Author version Link
-
S. Zellmann, M. Jaros, J. Amstutz, I. Wald (2025),
"GPU Volume Rendering with Hierarchical Compression Using VDB".
Eurographics Symposium on Parallel Graphics and Visualization (EGPGV 2025)
Link
-
A. Sahistan, S. Zellmann, N. Morrical, V. Pascucci, I. Wald (2025),
"Multi-Density Woodcock Tracking: Efficient & High-Quality Rendering for Multi-Channel Volumes".
Eurographics Symposium on Parallel Graphics and Visualization (EGPGV 2025)
Author Version
-
I. Wald, S. Zellmann, J. Amstutz, Q. Wu, K. Griffin, M. Jaros, S. Wesner (2024),
"Standardized Data-Parallel Rendering Using ANARI".
The 14th IEEE Symposium on Large Data Analysis and Visualization (LDAV 2024)
Preprint (Arxiv) Link
-
S. Zellmann, S. Demirci, U. Güdükbay (2023),
"Visual Analysis of Large Multi-Field AMR Data on GPUs Using Interactive Volume Lines".
2023 IEEE Visualization Conference (VIS)
Author version Link
-
S. Zellmann, I. Wald, J.
Barbosa, S. Demirci, A. Sahistan, U. Güdükbay (2022),
"Hybrid Image-/Data-Parallel Rendering Using Island Parallelism".
The 12th IEEE Symposium on Large Data Analysis and Visualization (LDAV 2022)
Author
version Link
-
S. Zellmann, I. Wald, A.
Sahistan, M. Hellmann, W. Usher (2022),
"Design and Evaluation of a GPU Streaming Framework for Visualizing Time-Varying AMR Data".
Eurographics Symposium on Parallel Graphics and Visualization (EGPGV 2022)
Author
version Link
Poster Presentations
-
S. Zellmann (2025),
"AMR Volume Rendering with ANARI".
Conference for Adaptive Mesh Refinement and Applications 2025 (AMR 25)
Poster (PDF)
Technical Reports and Pre-prints
-
S. Zellmann, J. Amstutz (arXiv pre-print),
"A Practical Guide to Implementing Off-Axis Stereo Projection Using Existing Ray Tracing Libraries".
Pre-print on arXiv.org
Link (arXiv.org)
-
Z. Wang, S. Wesner, S. Zellmann (arXiv pre-print),
"Immersive ExaBrick: Visualizing Large AMR Data in the CAVE".
Pre-print on arXiv.org
Link (arXiv.org)
-
J. A. P. Law-Smith, R. W. Everson, E. Ramirez-Ruiz, S. E. de Mink, L. A. C. van
Son, Y. Goetberg, S. Zellmann, A.
Vigna-Gomez, M. Renzo, S. Wu, S. L. Schroder, R. J. Foley, T. Hutchinson-Smith (arXiv pre-print,
under submission),
"Successful Common Envelope Ejection and Binary Neutron Star Formation in 3D Hydrodynamics".
Pre-print on arXiv.org
Link (arXiv.org)
Sample Codes
Here we provide links to code fragments generated during the course of the project;
VTV-AMR is a
basic research project, so that the primary output are not (and
cannot be) full-fledged (visualization) systems, but rather, prototypical sample
applications that
someone else could potentially integrate in
their own
visualization software.
Whenever possible, source code generated by VTV-AMR will be
published under non-restrictive open source licenses such as Apache2 or MIT.
exabuilder: CUDA-based AMR clustering tool
Link: https://github.com/szellmann/exabuilder
Description: This sample code accompanies our
AMR clustering paper.
The algorithms presented in that paper and sample code are the main contribution of the project VTV-AMR,
on fast, GPU-based construction of rendering-friendly hierarchies from "soup of AMR cells". The format
is compatible with the
ExaStitcher (as
well as the legacy
ExaBricks) tool. This format
is also under consideration for an upcoming version of the
ANARI standard.
dense2vdb compression library
Link: https://github.com/szellmann/dense2vdb
Description: This sample code accompanies our
VDB compression paper, which won a honorable
mention award at EGPGV 2025.
Interactive volume lines sample code (owlExaStitcher VIS 2023 Snapshot)
Link: https://github.com/owl-project/owlExaStitcher/tree/interactive-volume-lines
Description: Extension to owlExaStitcher, enabling an interactive visual analytics method we presented at VIS 2023
in Melbourne (
this paper).
The release can be found on the interactive-volume-lines branch.
Teaser video:
https://youtu.be/6g67sCP5JN4
anari-volume-viewer
Link: https://github.com/vtvamr/anari-volume-viewer
Description: Mini viewer application for ANARI volumes/spatial fields; supports structured-regular, AMR, and unstructured
field types. Can, e.g., be used with owlExaStitcher's AMR ANARI implementation.
NOTE: this project has been archived
This project has been superseded by NVIDIA's tsdViewer, all its components, including the FLASH importer have been ported over:
https://github.com/NVIDIA/VisRTX/tree/next_release/tsd/apps/interactive/viewer
owlExaStitcher (EuroVis/CGF 2023 Snapshot)
Link: https://github.com/owl-project/owlExaStitcher
Description: Visualization prototype and data structure we presented at EuroVIS 2023;
this software is grounded in the ExaBrick software (below) but can ports the visualization algorithm
to use interactive path tracing. It also for comparison has a sampler that uses the original ExaBrick data
structure.
FLASH to raw converter
Link: https://github.com/vtvamr/flash2raw
Description: Tool to convert from Rochester University's
FLASH format to a
structured raw format that can be read by virtually any volume renderer or
visualization system out there; useful for validation. The tool uses a
two-stage process; on the first stage, we generate cell data that is
readable by
ExaBricks.
That intermediate representation can then be resampled to a uniform grid
stored as a .raw file.
This software is primarily used (and therefore only tested) on the
Cheops HPC system at the University of Cologne.
ExaBrick (TVCG'21 Snapshot)
Link: https://github.com/owl-project/owlExaBrick
Description: Visualization prototype and data structure we presented at IEEE VIS 2020;
optimized for NVIDIA RTX GPUs with hardware ray tracing cores. This software
forms the basis for the developments in VTV-AMR. ExaBrick is based on
OWL by
Ingo Wald,
with whom we
collaborate on this project.
Visualizations
(Pics:) Click the thumbnail images for a larger version.
Path tracing of large-scale AMR data
Path traced rendering of NASA's exajet on a single GPU. This uses our
interactive renderer presented at EuroVis'24:
https://onlinelibrary.wiley.com/doi/10.1111/cgf.15095?af=R
Interactive volume lines
Visual analytics method we presented at VIS'23 in Melbourne. The data set is the
molecular cloud AMR data set by Seifried et al., this is an example where sci-vis
and VA share the same data structures to accelerate visualization of complex
topologies such as AMR. Find the paper pre-print/author version here:
https://pds.uni-koeln.de/sites/pds/szellma1/template.pdf
Animated Exajet
Presented at EGPGV'22 in Rome. See the
Publications page for the conference paper.
Exajet (courtesy Pat Moran with NASA) has a fixed AMR grid that doesn't change over time.
With that, it's different than other data we focus on; this however allowed us to focus
on the async. streaming procedere from NVMe SSD to GPU. The scalar data of each
frame is 2.54 GB in size; all the renderings in the video are interactive.
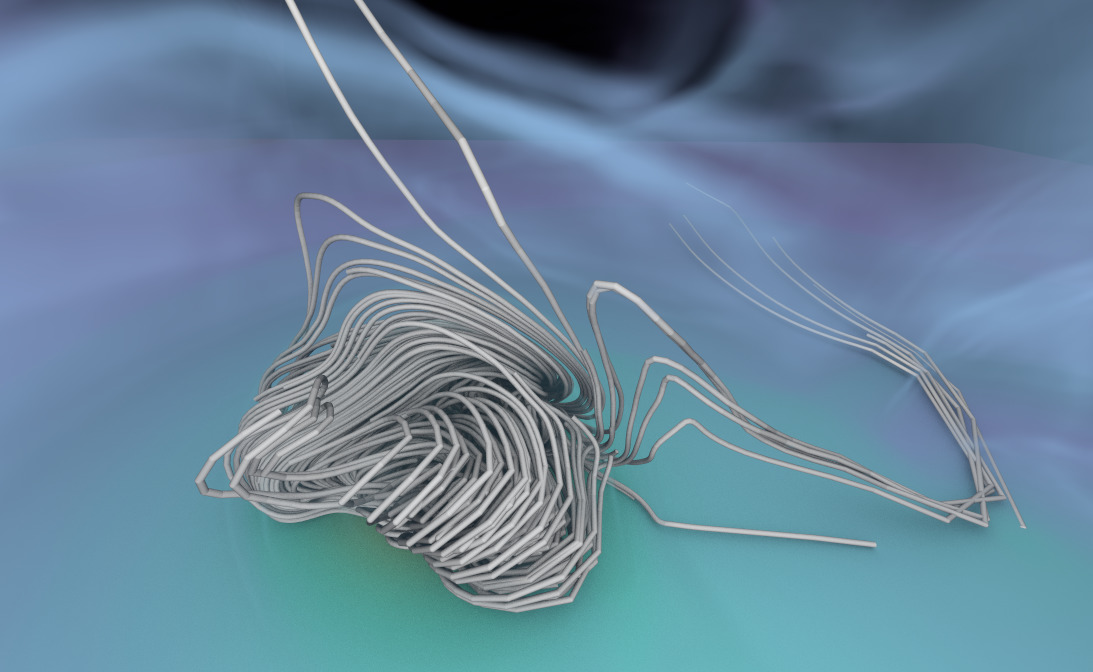
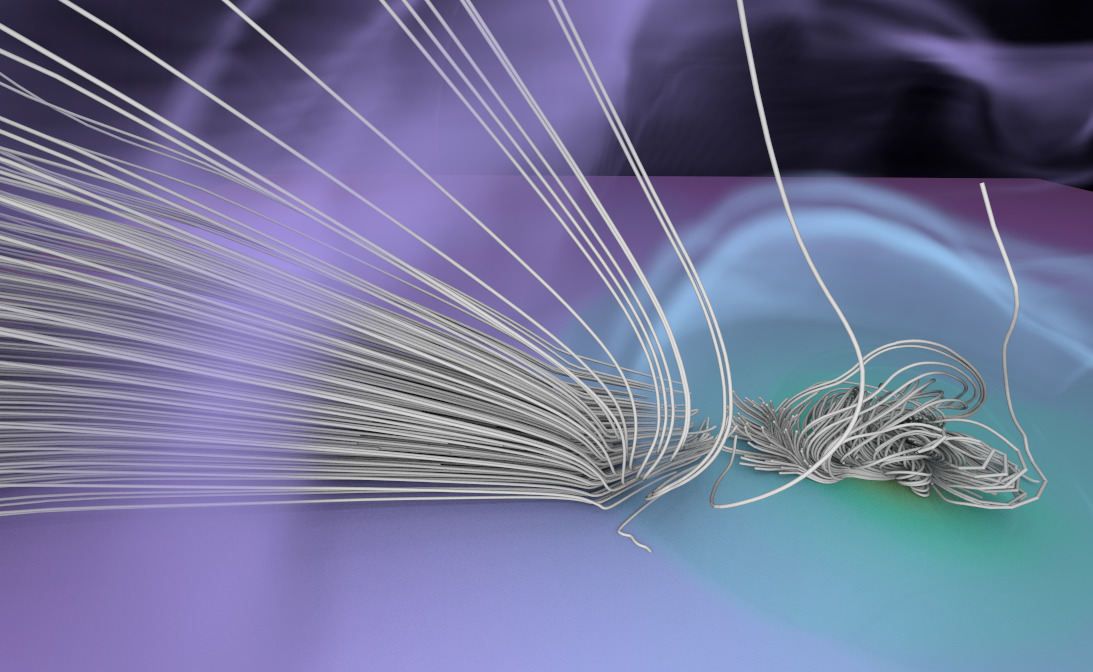
Particle Tracer
This visualization was generated in 2022 during the work on our
CiSE paper
on flow visualization with RT
cores; flow-vis is one of our milestones on the application side.
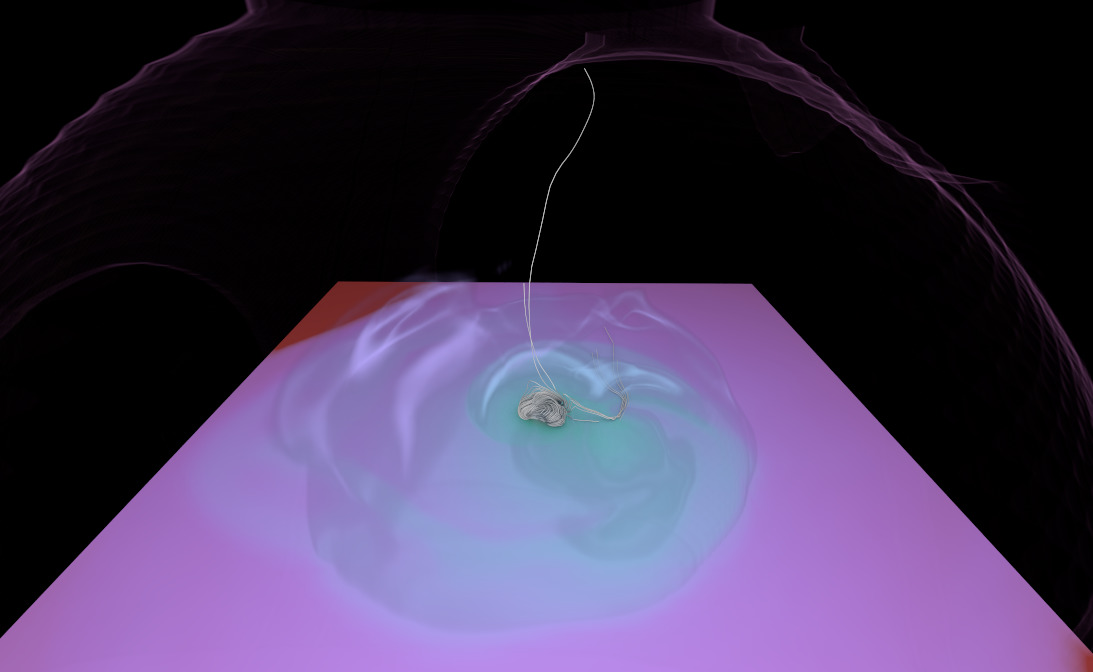
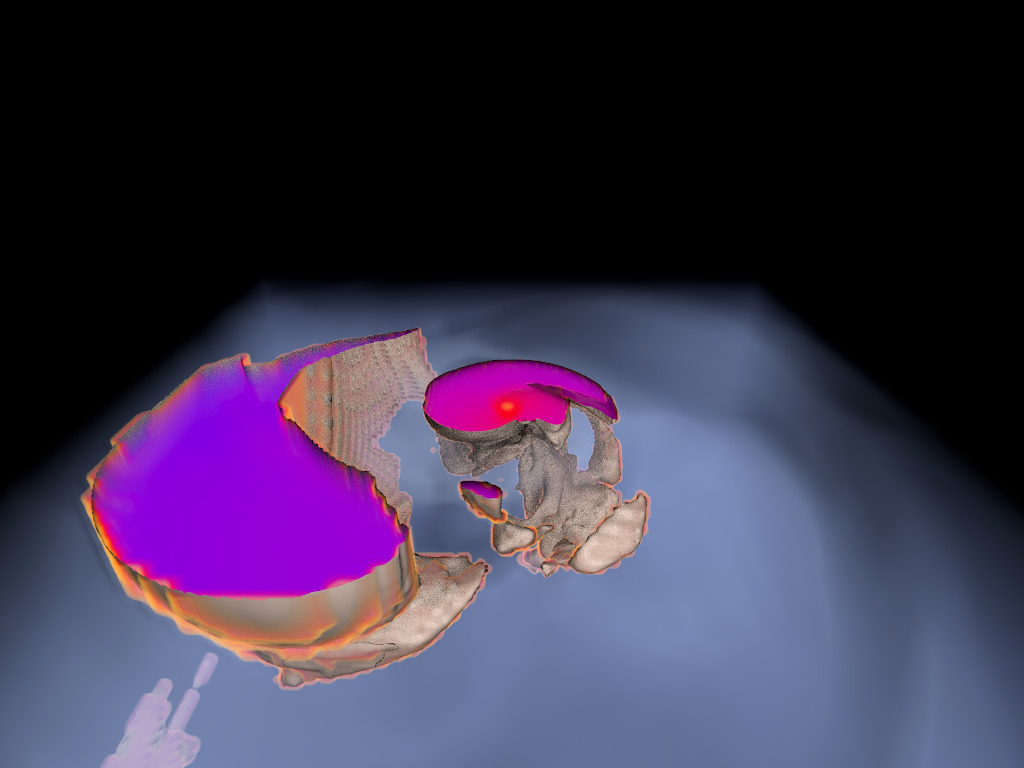
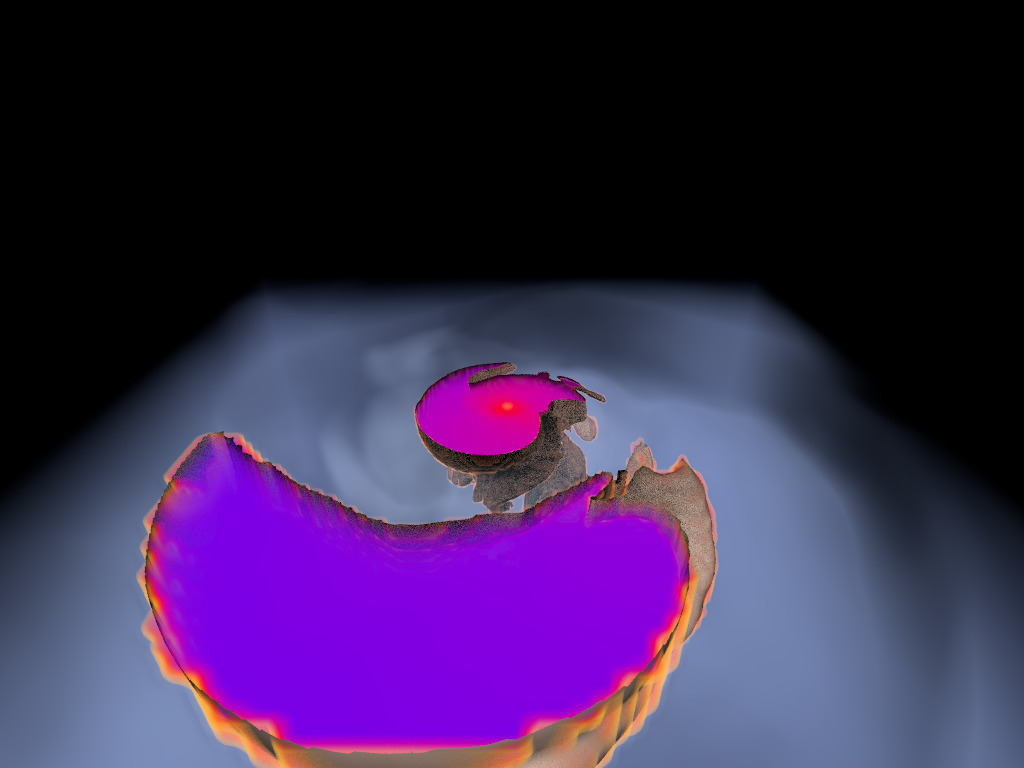
Binary Neutron Star (Animation)
This visualization was used to create (offline) animations from a FLASH simulation
(binary neutron star and common envelope ejection). See the arXiv pre-print on the
Publications page. Videos can be found on
Jamie Law-Smith's youtube channel: [
link].
Molecular Clouds
Visualizations made in preparation for the original VIS paper on ExaBrick in 2020.
The data are courtesy Daniel Seifried who's currently with the Theoretical Astrophysics
Group of the University of Cologne. The simulations were generated using the
FLASH AMR code.
Awards
Our research received the following awards:
Best Paper Award at EGPGV 2025
 A. Sahistan, S. Zellmann, N. Morrical, V. Pascucci, I. Wald (2025),
"Multi-Density Woodcock Tracking: Efficient & High-Quality Rendering for Multi-Channel Volumes".
Honorable Mention Award at EGPGV 2025
S. Zellmann, M. Jaros, J. Amstutz, I. Wald (2025),
"GPU Volume Rendering with Hierarchical Compression Using VDB".
Contact
For more information about this project, or to get in touch, shoot a message to:
Stefan Zellmann (PhD)
University of Cologne, Parallel and Distributed Systems (
Stefan Wesner's
chair)
Weyertal 121
50931 Cologne (GER)
Email:
zellmann
@
uni-koeln.de
Funding
This project is supported by the German Research Foundation (DFG), under Grant No. 456842964.
More information can be found under this [
link].